Put simply, observability is the ability to infer the internal states of a system based on the data it generates, such as logs, metrics, and traces. Observability is foundational to site reliability engineering. It’s a concept derived from control theory, particularly relevant to distributed systems due to the challenges in maintaining a cohesive whole. Observability enables teams to diagnose issues, understand system behavior, and predict future states.
With thousands of organizations adopting the Databricks Lakehouse as their platform of choice for all their Data & AI needs and mission-critical use cases, it’s natural for data teams to seek solutions that deliver health monitoring, quality control, and unified telemetry and logging for all Lakehouse assets. When combining these individual needs, it’s clear that organizations are looking for guidance to provide comprehensive observability for the Lakehouse. So, let’s review what’s available to achieve observability for the Lakehouse. As always, there is some sample code to help you get started.
Lakehouse Observability Pillars
| Pillar | Databricks Built-in Capability | Description |
|---|---|---|
| Unified Logging & Telemetry | System Tables (link) | System tables are a Databricks-hosted analytical store of your account’s operational data found in the system catalog. System tables can be used for historical observability across your account, including data lineage, auditing, and billing. |
| Audit Logs / Audit Log Delivery (link) | Databricks provides access to audit logs of activities performed by Databricks users, allowing enterprises to monitor detailed Databricks usage patterns. Delivery of audit logs in JSON file format can be sent to GCP storage bucket, AWS S3, or Azure Storage. | |
| Spark Log / Spark UI (link) | Different debugging options are available to peek at the internals of your Apache Spark application. The three important places to look are: Spark UI, Driver logs, and Executor logs. | |
| Data Quality | Lakehouse Monitoring (link) | Databricks Lakehouse Monitoring lets you monitor the statistical properties and quality of the data in all of the tables in your account. You can also use it to track the performance of machine learning models and model-serving endpoints by monitoring inference tables that contain model inputs and predictions |
| DLT Expectation (link) | Expectations allow you to guarantee data arriving in tables meets data quality requirements and provide insights into data quality for each pipeline update. You apply expectations to queries using Python decorators or SQL constraint clauses. | |
| Health Monitoring | Status Portal (link) | The Databricks Status Page provides an overview of all core Databricks services. You can easily view the status of a specific service by viewing the status page. You can also subscribe to status updates on individual service components. This sends an alert whenever the status of the service you are subscribed to changes. |
| Alerting (link) | Use Alerts created on top of System Tables or any table in Databricks. Databricks SQL alerts periodically run queries, evaluate defined conditions, and send notifications if a condition is met. You can set up alerts to monitor your business and send notifications when reported data falls outside of expected limits. |
Partner Solutions and Open Source Options
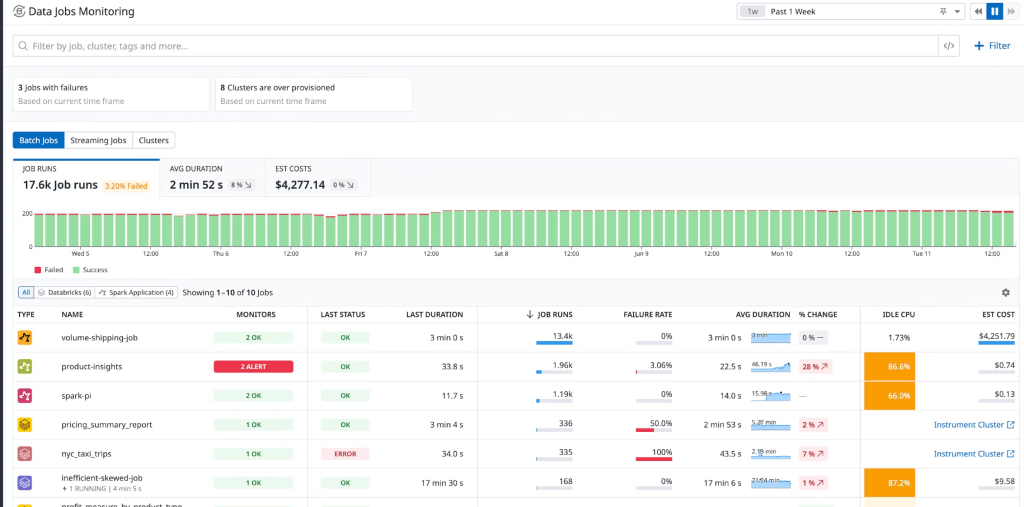
For each of these pillars, there are excellent partner tools that help augment the built-in observability capabilities. For example, Datadog offers an end-to-end solution for monitoring Databricks. Datadog’s Databricks integration unifies infrastructure metrics, logs, and Spark performance metrics to provide real-time visibility into the health of your nodes and the performance of your jobs. Datadog’s Data Jobs Monitoring helps you observe, troubleshoot, and cost-optimize Spark and Databricks jobs and clusters. Below is an example dashboard (courtesy of Datadog):
Another great option is New Relic. Their Spark integration collects detailed job and stage metrics, giving you granular insights into job performance at a glance. For instance, you can break down the Job metric by status (successful, pending, or failed) to monitor real-time performance.
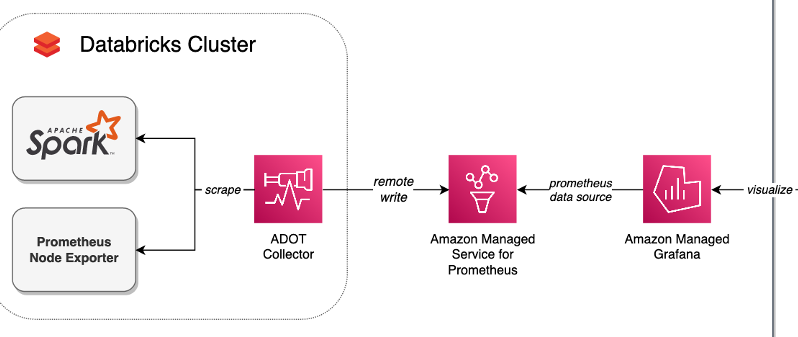
Finally, since Azure Databricks offers deep integration with Azure Monitor, it’s a powerful option for those on Azure. On AWS, there are great examples of monitoring Databricks with open-source tools like Prometheus and Grafana. This article (picture included) describes how to implement these using managed open-source services.
Delivering Custom Telemetry: Table Level Sample Code
There are scenarios where organizations need custom observability metrics based on their operational goals, such as table-level telemetry with information on table growth over time and data freshness. To address this, I’ve built this notebook that computes and consolidates metrics for the Lakehouse into a unified Delta table, making it easy to build operational dashboards. It provides the following insights:
- Inventory of all tables: Including their format and storage location.
- Table size and growth over time.
- Data Freshness: Change dates for tables.
- Last optimization and vacuum dates.
The notebook works by querying the system.information_schema table based on a provided regular expression to find the desired tables. It then uses DESCRIBE DETAIL and DESCRIBE HISTORY for each table to collect the appropriate metrics. To ensure idempotency, the notebook uses a temporary table and only replaces the records in the destination table at the end with an atomic MERGE.
It scales well. In initial tests, the notebook script was able to process 314 tables in 20 minutes using a 3-node cluster with 32GB nodes. Opting for a larger master node and more workers is likely to improve performance and run the script even faster.
Let’s wrap up with a snippet of the code provided in the notebook. Enjoy!
def get_table_telemetry(catalog, schema, table, table_format):

  details = spark.sql(f"DESCRIBE DETAIL `{catalog}`.`{schema}`.`{table}`").collect()[0]

  last_vacuum_date = None
  last_optimize_date = None
  last_write_date = None

  if table_format == "DELTA":
    history = spark.sql(f"DESCRIBE HISTORY `{catalog}`.`{schema}`.`{table}`").orderBy("timestamp", ascending=False).collect()


    last_vacuum_date = get_first_timestamp(["VACUUM"], history)
    last_optimize_date = get_first_timestamp(["OPTIMIZE"], history)
    last_write_date = get_first_timestamp(["WRITE", "MERGE", "DELETE", "UPDATE"], history)

  size_in_mb = 0 if details["sizeInBytes"] is None else details["sizeInBytes"] / (1024 * 1024)
  partition_columns = ",".join(details["partitionColumns"]) if details["partitionColumns"] is not None else ""
  clustering_columns = ",".join(details["clusteringColumns"]) if details["clusteringColumns"] is not None else ""
  storage_location = details["location"]


  return {
        "lastVacuumDate": last_vacuum_date,
        "lastOptimizeDate": last_optimize_date,
        "lastWriteDate": last_write_date,
        "sizeInMB": float(size_in_mb),
        "storageLocation": storage_location,
        "partitionColumns": partition_columns,
        "clusteringColumns": clustering_columns,
        "sizeHistory" : json.dumps([{
          "size" : float(size_in_mb),
          "date" : datetime.now().strftime('%Y-%m-%d')
        }])
  }
Leave a comment